Modeling Functional Relationships with Tables and Graphs F.IF.4 Grade 11 ACTASPIRE Practice Test Questions TOC | Lumos Learning

Modeling Functional Relationships with Tables and Graphs F.IF.4 Question & Answer Key Resources Lumos StepUp High School Integrated Mathematics 1 - Workbooks and Online Assessments

Lumos StepUp High School Integrated Mathematics 1 - Workbooks and Online Assessments Modeling Functional Relationships with Tables and Graphs

         Get Full Access to Lumos StepUp High School Integrated Mathematics 1 - Workbooks and Online Assessments

Currently, you have limited access to Lumos StepUp High School Integrated Mathematics 1 - Workbooks and Online Assessments. The Full Program includes,

Buy ACTASPIRE Practice Resources
Lumos online Step Up Program is designed to Improve student Achievement in the Grade 11 ACTASPIRE Assessment Click Here To Learn MoreOnline Program

GO BACK

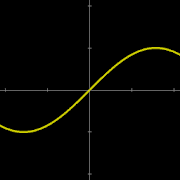
The graph shows the population of bison at a national game refuge in Wyoming. To the nearest 100, what is the maximum population of bison in the refuge?