Scatter Plots, Line of Best Fit 8.SP.A.2 Grade 8 PSSA Practice Test Questions TOC | Lumos Learning

Scatter Plots, Line of Best Fit 8.SP.A.2 Question & Answer Key Resources Grade 8 Mathematics - Skill Builder + PSSA Practice

Grade 8 Mathematics - Skill Builder + PSSA Practice Scatter Plots, Line of Best Fit

         Get Full Access to Grade 8 Mathematics - Skill Builder + PSSA Practice

Currently, you have limited access to Grade 8 Mathematics - Skill Builder + PSSA Practice. The Full Program includes,

Buy PSSA Practice Resources
Printed PSSA Practice Book Available For Grade 8 Click Here To Learn MorePrinted Books Lumos online Step Up Program is designed to Improve student Achievement in the Grade 8 PSSA Assessment Click Here To Learn MoreOnline Program

GO BACK

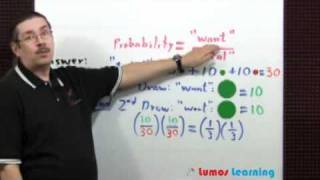
Write the prediction equation for this graph using the two labeled points. Leave as fractions.

Instruction: Write your answer in the form as given here : y=(m)x+b (Do not give any spaces in between). If m and b are fractions, write them in the format p/q.