Solve Problems Using Data Represented in Bar Graphs, Dot Plots, and Circle Graphs 7.CCSS.DA.DS.1 Grade 7 STAAR Practice Test Questions TOC | Lumos Learning

Solve Problems Using Data Represented in Bar Graphs, Dot Plots, and Circle Graphs 7.CCSS.DA.DS.1 Question & Answer Key Resources Grade 7 Mathematics - STAAR Redesign Practice + Skills Mastery

Grade 7 Mathematics - STAAR Redesign Practice + Skills Mastery Solve Problems Using Data Represented in Bar Graphs, Dot Plots, and Circle Graphs

         Get Full Access to Grade 7 Mathematics - STAAR Redesign Practice + Skills Mastery

Currently, you have limited access to Grade 7 Mathematics - STAAR Redesign Practice + Skills Mastery. The Full Program includes,

Buy STAAR Practice Resources
Printed STAAR Practice Book Available For Grade 7 Click Here To Learn MorePrinted Books Lumos online Step Up Program is designed to Improve student Achievement in the Grade 7 STAAR Assessment Click Here To Learn MoreOnline Program

GO BACK

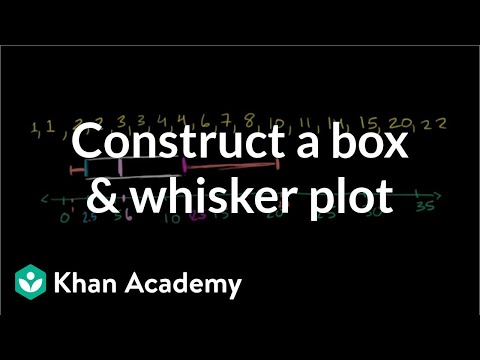
A.J. has downloaded 400 songs onto his computer. The songs are from a variety of genres. The circle graph below shows the breakdown (by genre) of his collection. Use the information shown to answer the question.

A.J. has 100 R&B songs. About how many pop songs does he have?