Solve Problems Using Data Represented in Bar Graphs, Dot Plots, and Circle Graphs 7.CCSS.DA.DS.1 Grade 7 STAAR Practice Test Questions TOC | Lumos Learning

Solve Problems Using Data Represented in Bar Graphs, Dot Plots, and Circle Graphs 7.CCSS.DA.DS.1 Question & Answer Key Resources Grade 7 Mathematics - STAAR Redesign Practice + Skills Mastery

Grade 7 Mathematics - STAAR Redesign Practice + Skills Mastery Solve Problems Using Data Represented in Bar Graphs, Dot Plots, and Circle Graphs

         Get Full Access to Grade 7 Mathematics - STAAR Redesign Practice + Skills Mastery

Currently, you have limited access to Grade 7 Mathematics - STAAR Redesign Practice + Skills Mastery. The Full Program includes,

Buy STAAR Practice Resources
Printed STAAR Practice Book Available For Grade 7 Click Here To Learn MorePrinted Books Lumos online Step Up Program is designed to Improve student Achievement in the Grade 7 STAAR Assessment Click Here To Learn MoreOnline Program

GO BACK

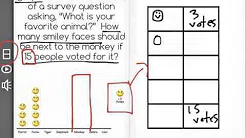
Use the graph below to answer the following question.
How many more pennies are there than nickels? Drag your answer into the box.